

- Click the arrow for the checklist item, the FFT display will appear.
- Double check you have your microphones set up for spatial averaging. If using one microphone, place it at the MLP.
- Make sure the room is quiet, and touch the "Play" control. A pink noise LFE tone will play through the subs from the Apple TV.
- After the plot has stabilized, hit "Pause" and save the plot using the "+" control. You can change the caption if you wish but the time stamp is useful.
- Select the lowest or loudest peak on the plot. Place your finger on the screen and move the red line that appears to the center of the peak.
- Note the center frequency and the level of the peak over the average level of the overall plot.
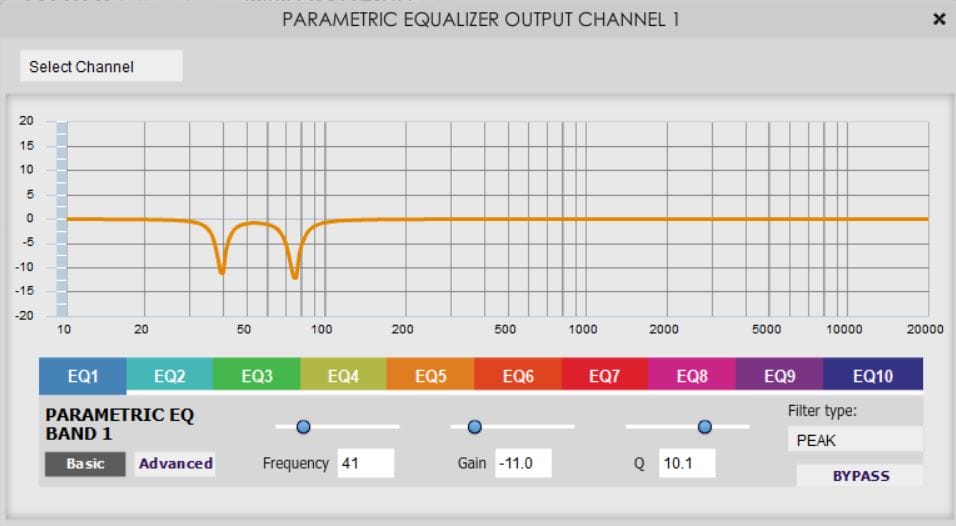
- Now you're ready to input a parametric filter. Typically it requires the input of the center frequency, a negative gain, and a Q-factor.
- Choose half of the peaks level you noted earlier as the gain setting. Be sure to enter a negative number since we want to reduce the peak.
- For the Q-Factor use a starting value of 8. A higher number creates a narrower filter. Your goal is to create a negative version of the peak to cancel it.
- Implement the filter (some EQs add the filter automatically in real-time). Repeat your measurement and note the change in the shape of the peak.
- One of the advantages of the "Scratch Pad" is the ability to compare plots.
- If you choose to make incremental measurements (recommended for a beginner), you can see more clearly how the plot responds to the filter.
- As you get a better idea of the process, you might consider observing the changes in response while the measurement is running. This is faster.
- It's very important to note that dips are not ordinarily EQ-able. This means that try to smooth the plot by cutting peaks rather than lifting dips.
- If you try to insert a positive filter for a dip you'll usually see only a minor change in the dip. In this case, take the filter out since it might cause the sub to clip.
- You can experiment with the gain and the Q until you see a smooth plot at the center frequency.
- We started the process with a smaller gain setting than the peak. Depending on the Q of the peak you might need to adjust that.
- Keep in minf we want the Q (width of the filter) to match the actual peak on the plot.
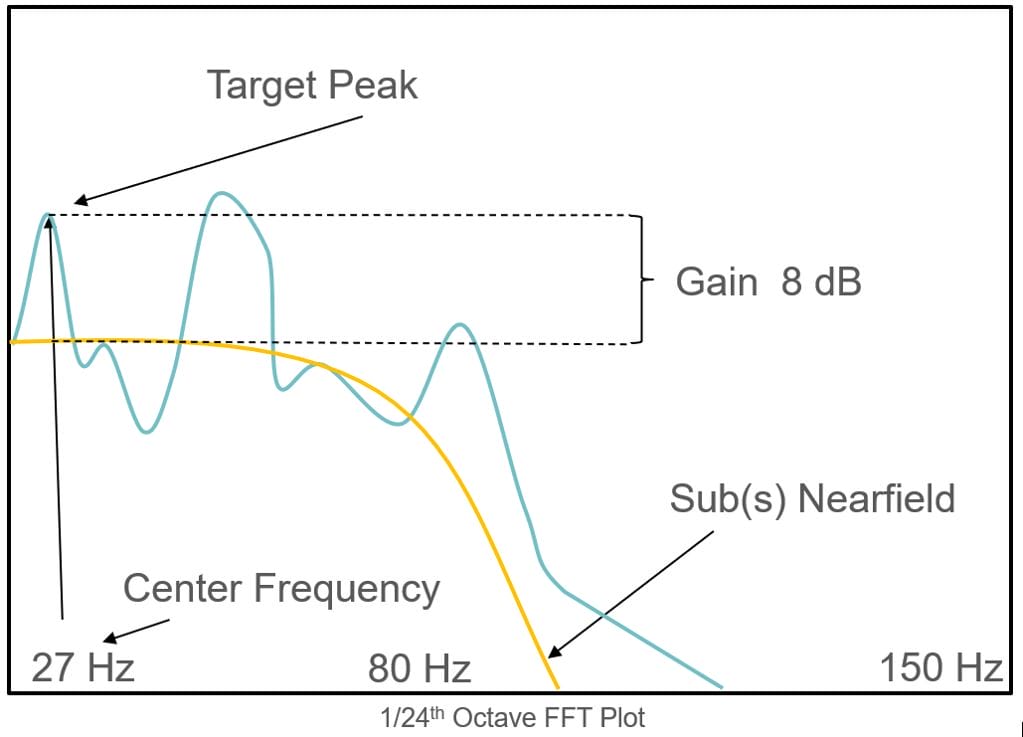
- The plot on the left shows that our filter is too narrow and we need a wider Q-factor.
- Be careful of too wide of a Q-factor, you might get the allusion that you smoothed the plot but you're not matching the peak parameters effectively.
- Until you gain experience, it's a good idea to try to minimize the filter settings; don't over EQ.
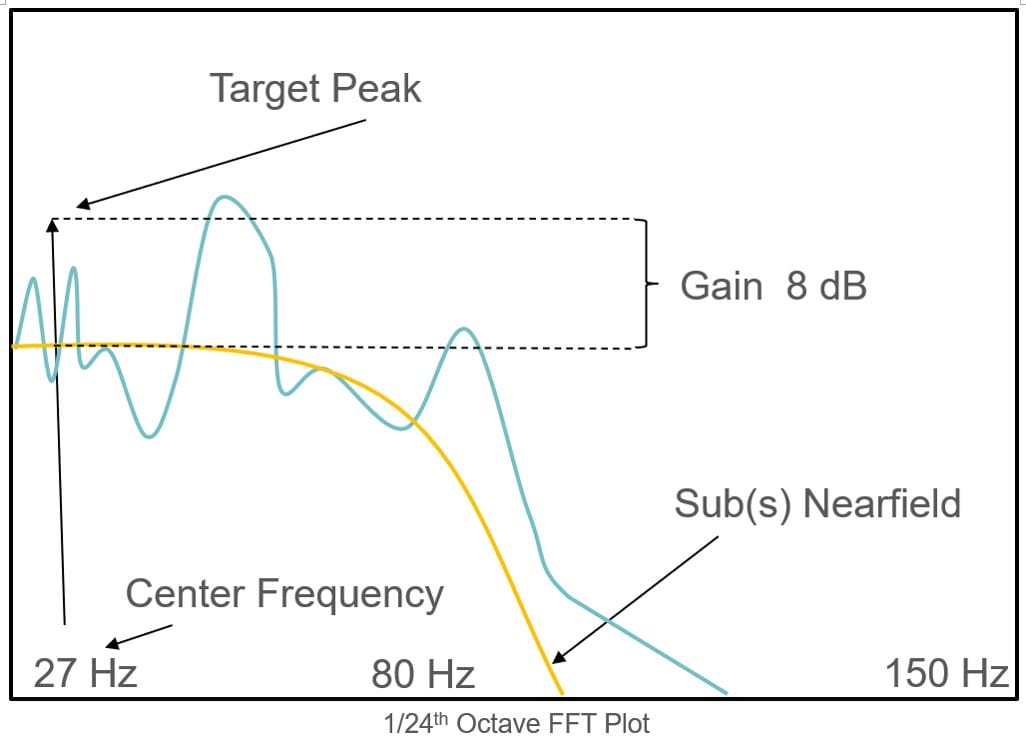
- You might also see a misshaped peak such as the large peak higher in frequency we see on the left.
- This often indicates there are two peaks requiring two filters. This points out the value of a high resolution FFT to perform this process.
- When the plot looks similar to the near field plot you took of the sub earlier. You're done.
- Touch the return arrow to leave the test. Once back at the checklist, don't forget to touch the check mark and mark the item complete.