

- Press the arrow icon next to the checklist item name to open the FFT measurement.
- The best approach is to use an array of microphones to obtain a spatial average of the response.
- Tips for microphone placement are in the Calibration Setup help page.
- We recommend using "Average" sample rate. Touch the control below the plot on the right to change.
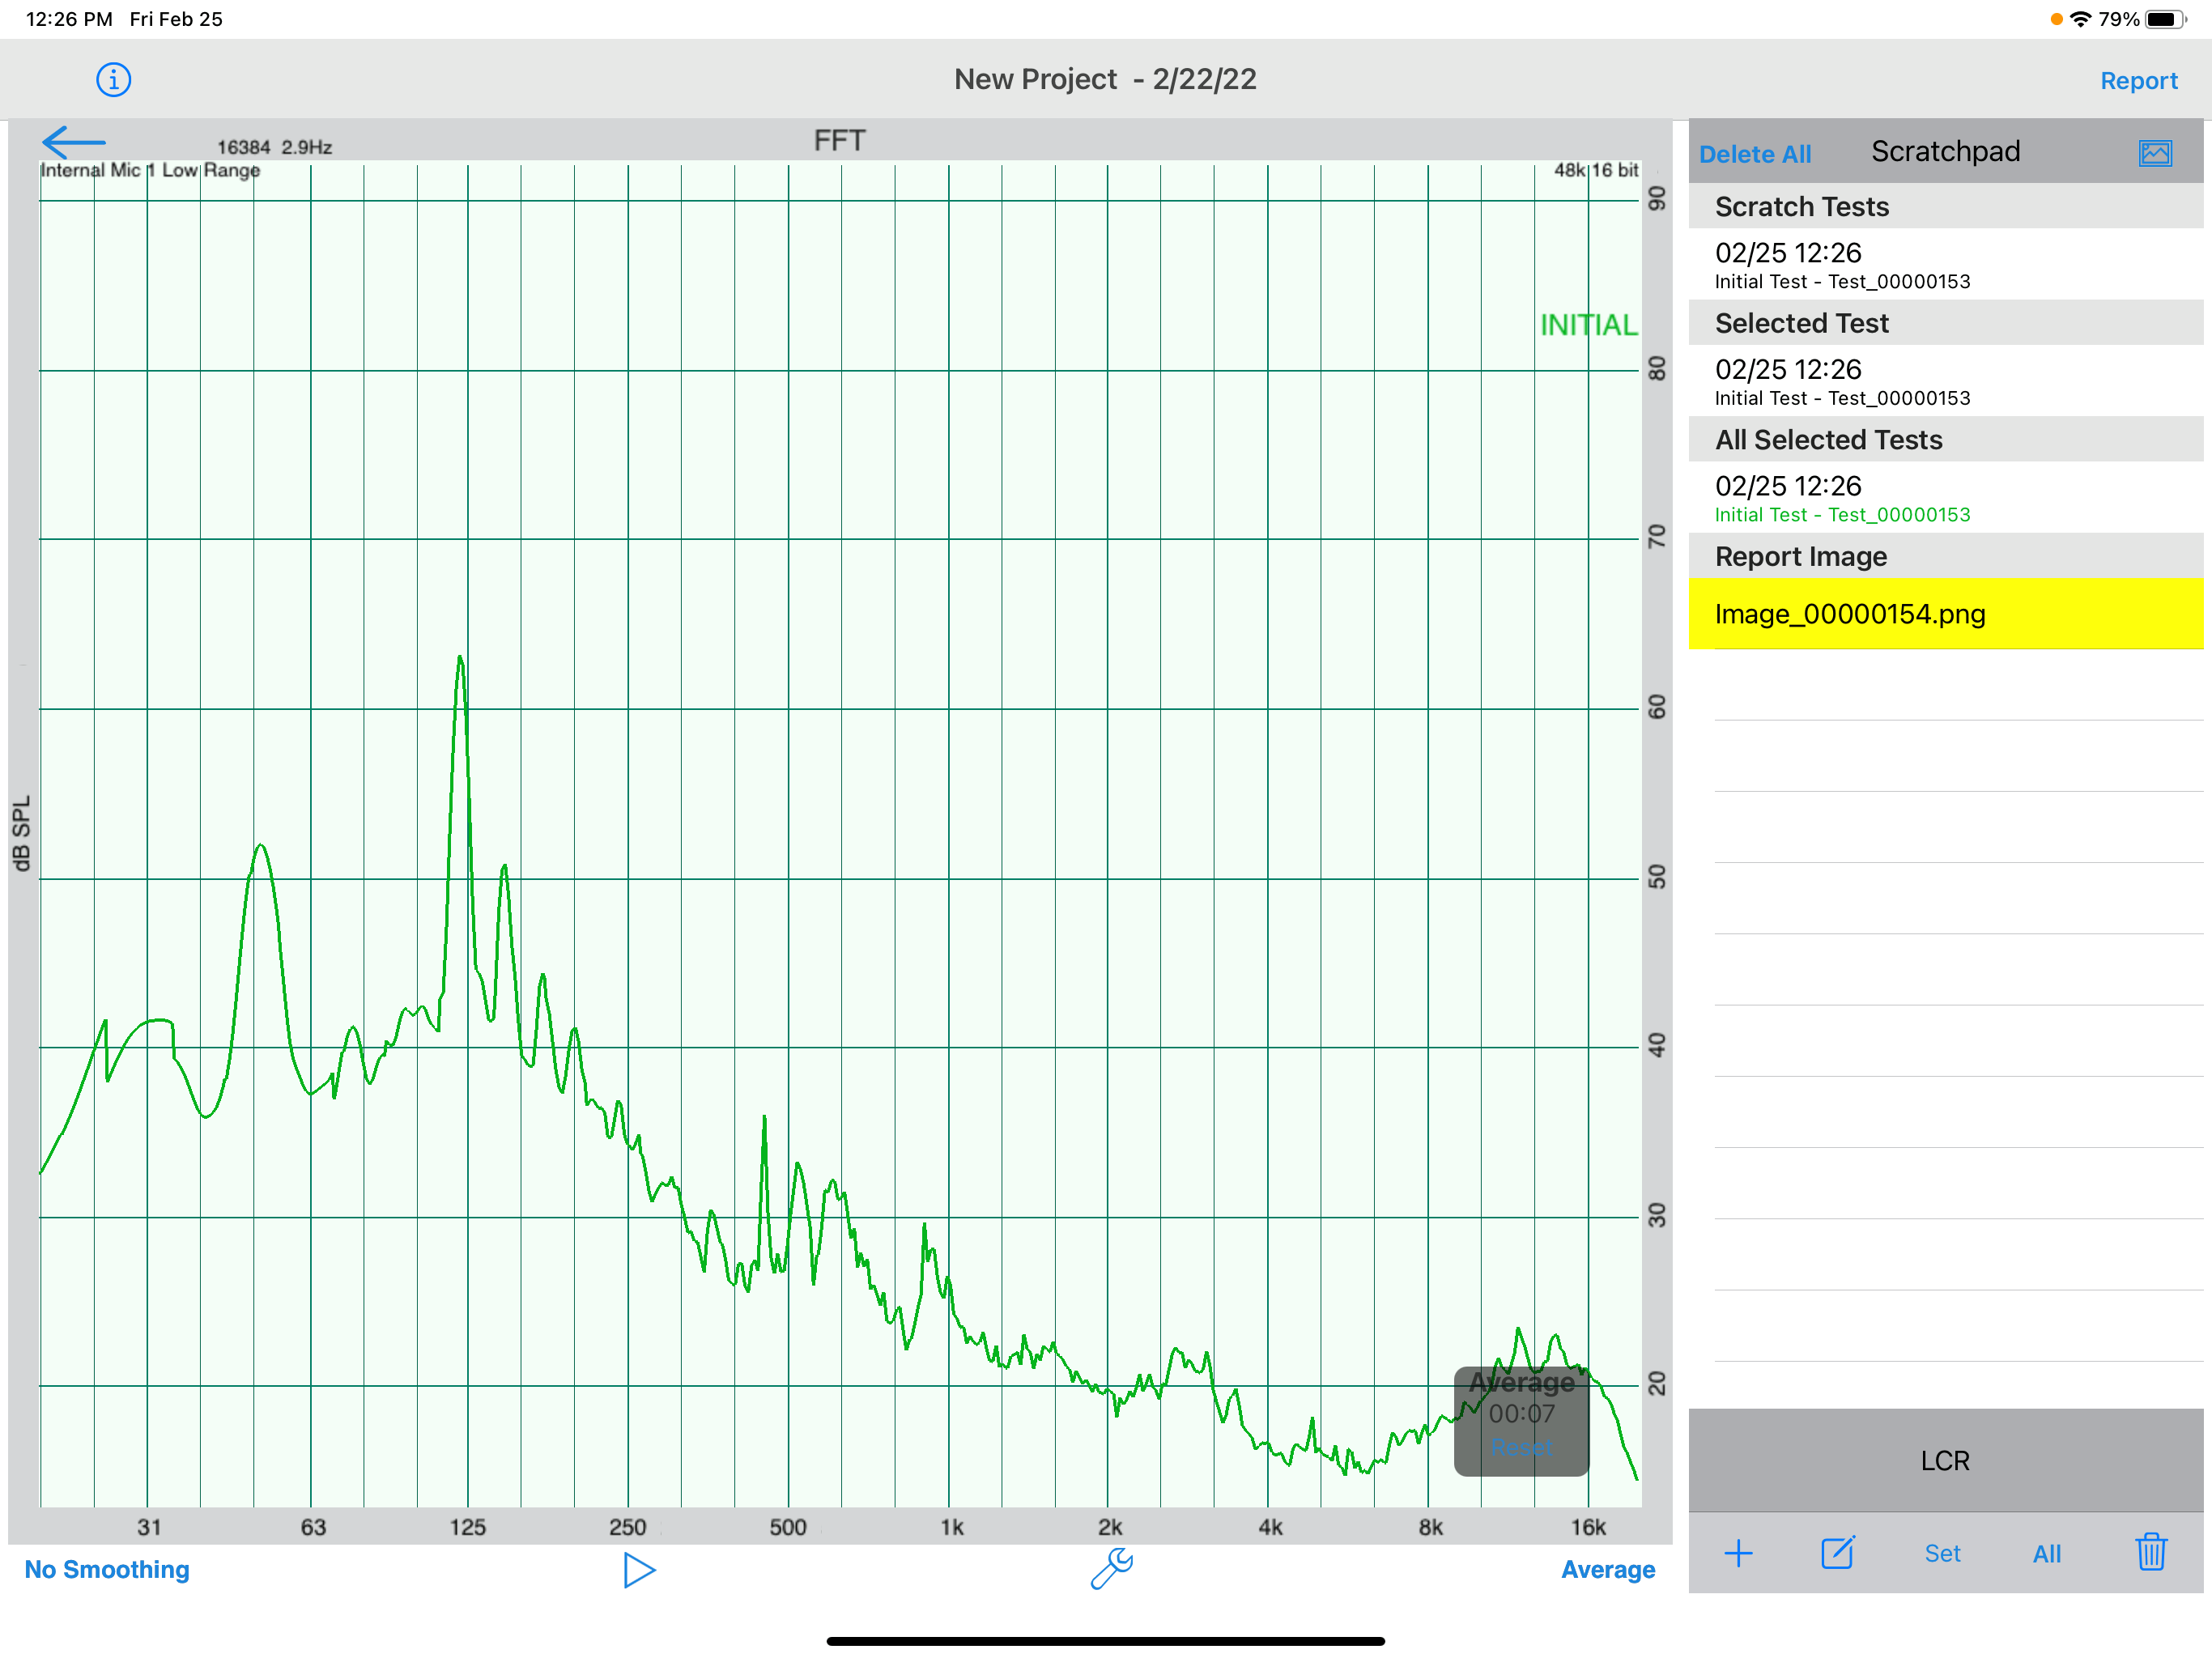
- Once the room is silent, touch the play control to begin the measurement. The "LCR" test tone will be initiated by the Apple TV.
- You can restart the measurement by tapping the "Reset" control inside the inset Average window. It's a good idea to do this at each start anyway to clear old data.
- Once the plot has stabilized (a few seconds for a spatial array of mics), touch the pause button.
- If you're satisfied with the plot, click the "+" control to save it. You can customize the plot label at this point as well.
- To complete, press the screenshot icon on the top right. The picture will appear and you can close the picture by touching the new label under "Report Image".
- Touch the arrow on the top left to leave the test.
- Once back to the checklist, don't forget to mark the checklist item complete and add comments by touching the check mark on the bottom right.

Scratchpad
- Scratchpad is a powerful way to compare multiple plots and select the best one.
- You add plots to the Scratchpad when you touch the "+" control. You can see the time/stamp or the custom label you created in the Scratch Tests area.
- You can take multiple tests/measurements, compare them, then select the best by viewing it and selecting the "Set" control at the bottom.
- The current selected test is shown under the "Selected Test" label.
- You can pick any test/plot and compare it to the selected test.
- The "All" control is useful in tests where the end result is to overlay multiple plots such as the Nearfield checklist item. Selecting it again clears the plot screen.
- You can delete any plot using the trash can icon or you can delete all tests/plots using the "Delete All" control on the top.
- The edit icon allows you to change any plots caption.